
Impact map
| |
What?An impact map is a diagram that shows the flows of materials and energy over the whole-life of a product. Technology product example. You can click on the image below to view it full-screen, then you can zoom in to the level required to read the text. This image is also available as a PowerPoint file. 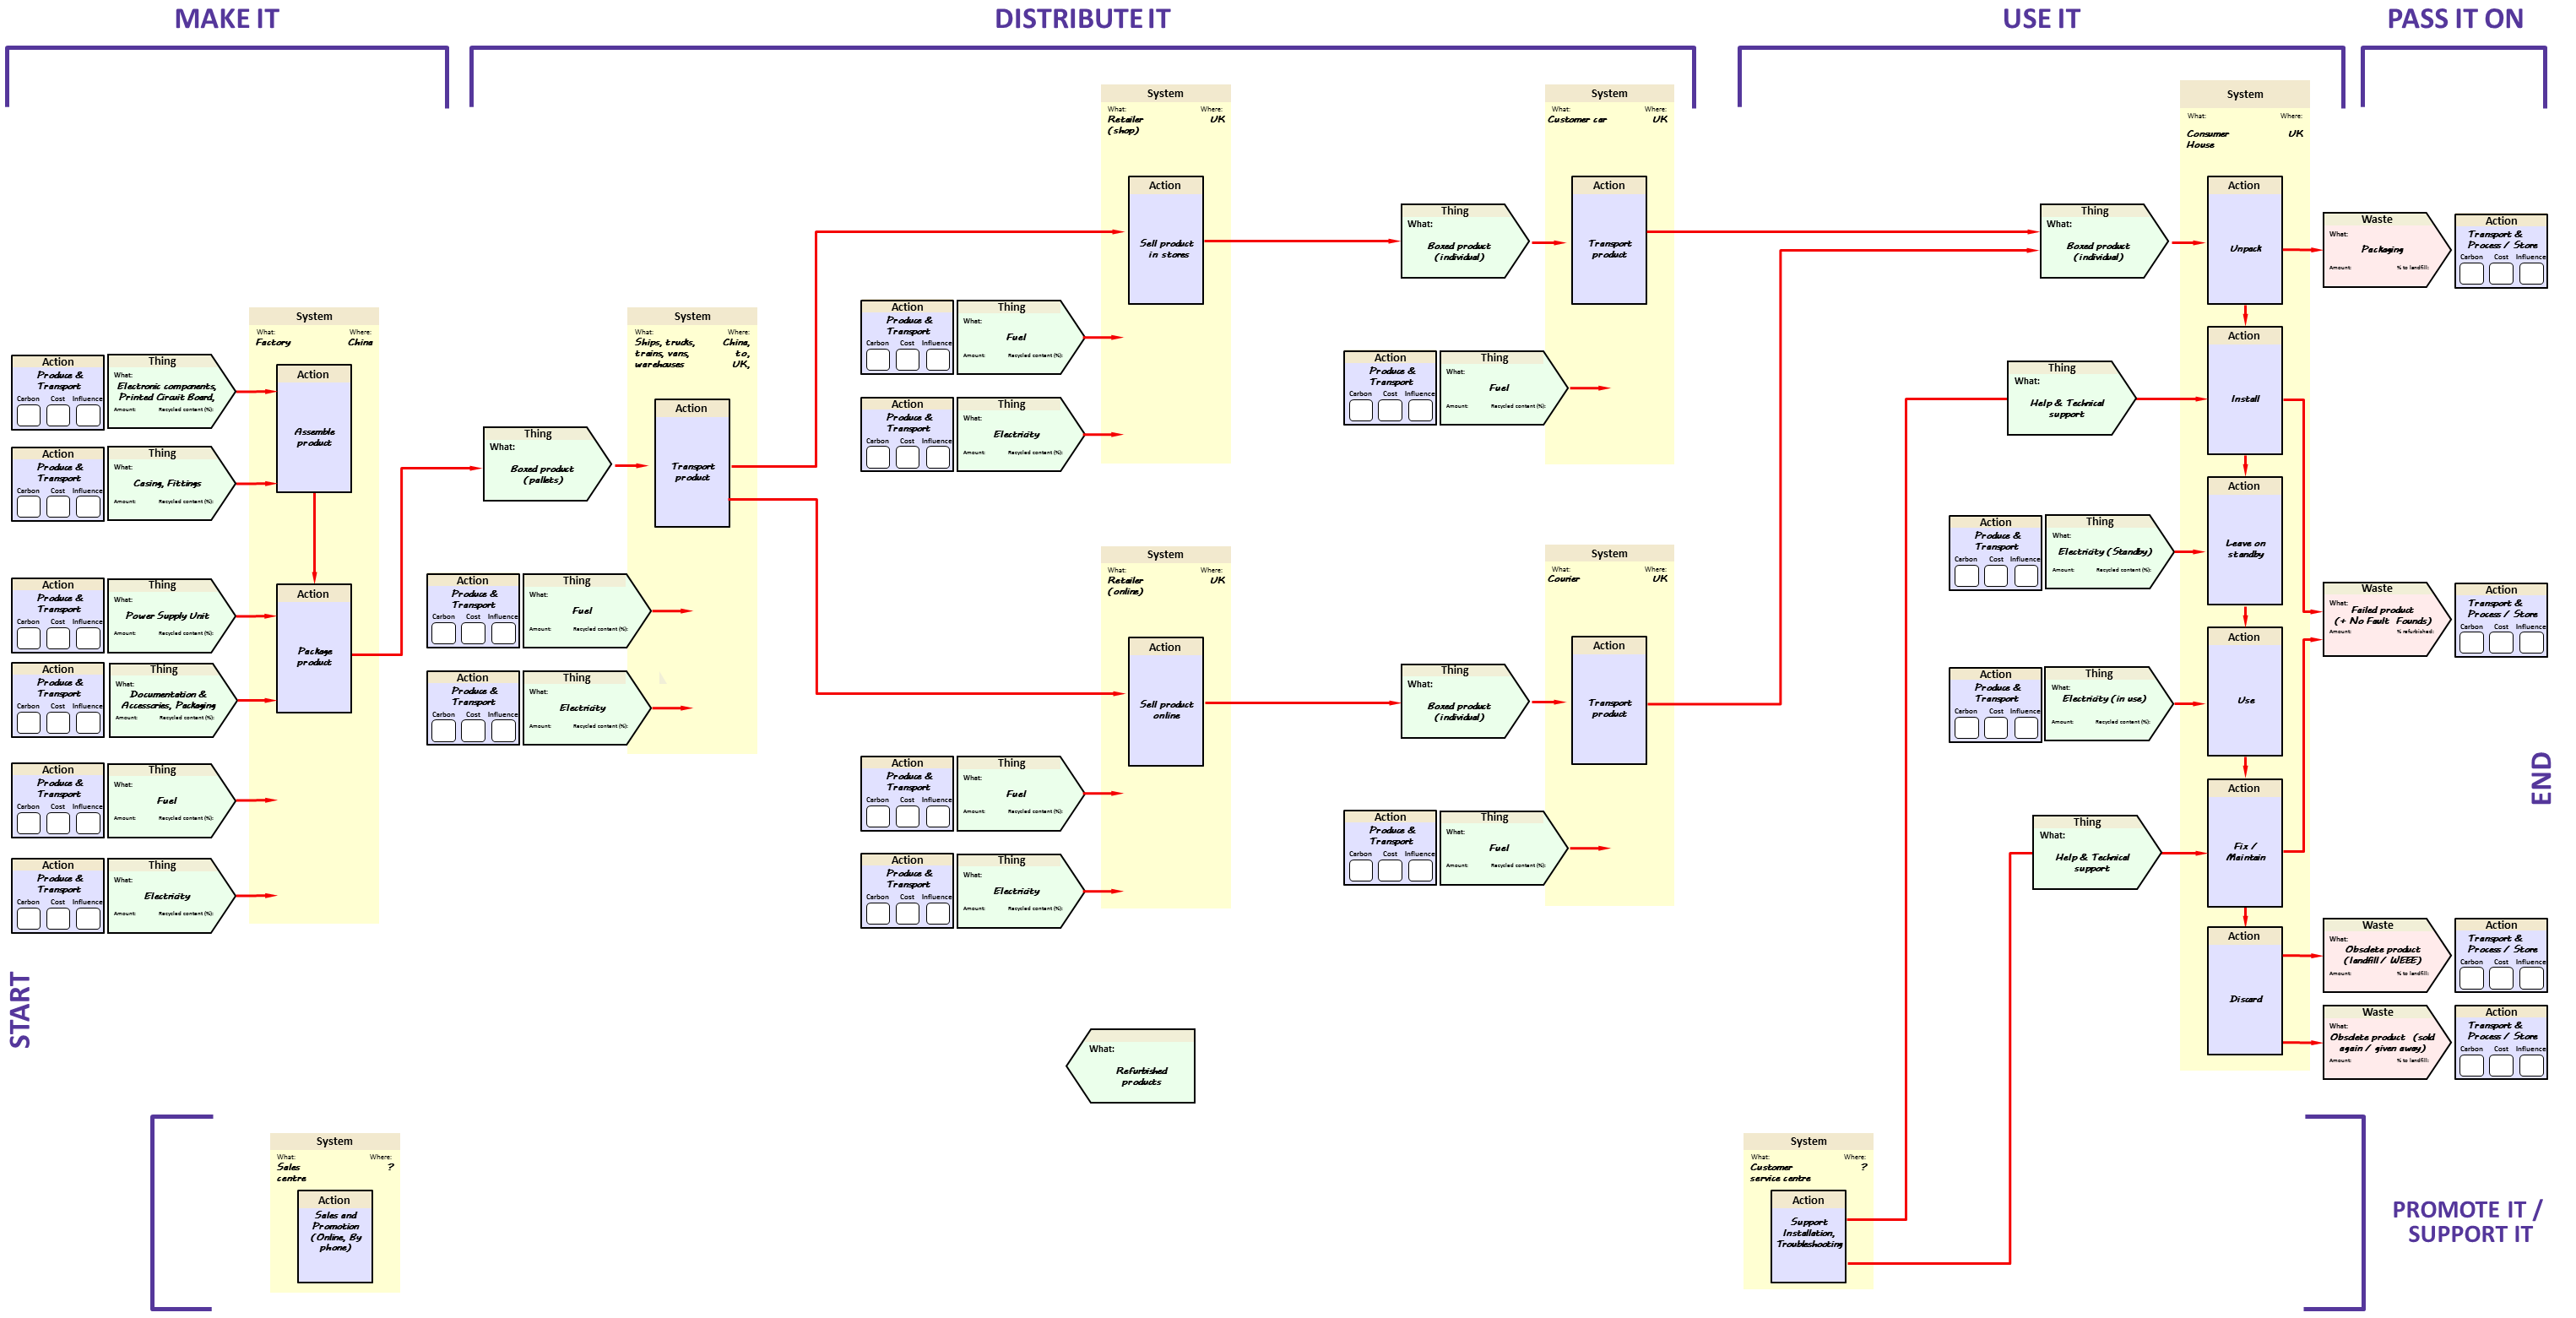
Why?Creating an impact map helps to set priorities for improvement, based on the 'hot-spots' corresponding with the biggest impacts, across the whole-life of the product. How?An impact map can be drawn using a pen and paper, or any computer drawing package, such as Microsoft PowerPoint. In order to draw an impact map, you should:
Contact: edc-toolkit@eng.cam.ac.uk to find out about consultancy support for producing an impact map. |
|
Feedback
We would welcome your feedback on this page: