
Explore
| |||
|
This page describes activities within the 'Explore' phase of the design cycle, which is about understanding the user and business stakeholders, the real-world scenarios of use, and the flows of materials and energy across the whole-life of the product. These findings should be drawn together to determine 'What matters?' for performance indicators that cover the users, the business, the wider society and the planet. The stakeholders, real-world scenarios of use, and flows of materials and energy are considered relative to a benchmark, and choosing this benchmark is the first activity within this phase. The remaining activities, described later on this page, are: |
 choose benchmark product
Create stakeholder map
Describe user journeys
Create map of impacts
Review performance indicators
choose benchmark product
Create stakeholder map
Describe user journeys
Create map of impacts
Review performance indicators
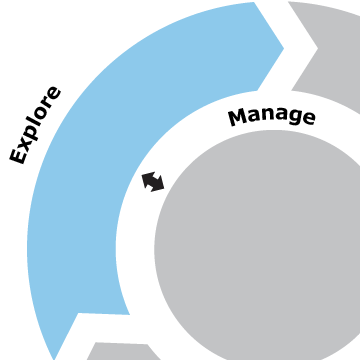
You can click on this map to navigate this page. Show full Design wheel | ||
Choose benchmark | |||
|
The set of concept design activities described within the Design wheel are all based around a starting point of a relative comparison between a proposed new concept and a chosen benchmark. Relative comparison is used because it is much easier to judge whether something is 'better' or 'worse' than something else, and much harder to make an objective assessment of whether something is 'good' or 'bad'. The current product (or an equivalent competitor product) could be used as a benchmark. However, if you wanted to develop a breakthrough product, or shift from a product you a service, you might choose multiple existing product/service combinations that provide equivalent benefits to the user as the concept being developed. Comparing a new concept against an existing solution neglects any evaluation of factors that are the same across both alternatives. For example, if both the new concept and the benchmark end up as toxic waste after the end of their useful life, this problem would not be highlighted by comparative evaluation. The benchmark should therefore be carefully chosen so that it simplifies everything that you want to neglect, without missing out any of the priorities that you want to improve. The choice of benchmark should align with the 'Productgoals' identified within the Manage section. |
choose benchmark product
Create stakeholder map
Describe user journeys
Create map of impacts
Review performance indicators
'Choose benchmark' is one of the activities within 'Explore'. Show full 'Design wheel'. | ||
Create stakeholder map | |||
|
Using the chosen benchmark as the starting point, identify the key players who have something to gain or lose from the concept being developed. Examples include designers, manufacturers, retailers, purchasers, installers, users, supporters, maintainers, refurbishers, regulators and shareholders. . Market segmentation and personas can help to characterise the different types of users. In the Evaluate phase the full range of stakeholders are summarised according to the Chief 'X' Officers: CFO, CTO, COO, CMO, CSO (Financial, Technical, Operations, Marketing, Sustainability). |
choose benchmark product
Create stakeholder map
Describe user journeys
Create map of impacts
Review performance indicators
'Create stakeholder map' is one of the activities within 'Explore'. Show full 'Design wheel'. | ||
| |||
Describe user journeys | |||
|
Describe the real-world scenarios of use according to the tasks that the user performs across the whole-life of the benchmark product. This should include purchase, installation, use, end-of-life triggers and subsequent actions. The scenarios should consider what happens when things go wrong, and provide context by including the actions the user performs immediately before and after using the product. The real-world scenarios should be investigated through user observation. The journeys can be described by writing down each user action, and are further enhanced by the addition of photographs. The user journey should be used as a prompt in order to help evaluate any proposed concept according to whether it's better or worse for every task step, across the whole-life of the product. Problems uncovered after launch are often caused by a design change that improved one aspect of the user journey, but caused unintended consequences for another aspect. |
choose benchmark product
Create stakeholder map
Describe user journeys
Create map of impacts
Review performance indicators
'Describe user journeys' is one of the activities within 'Explore'. Show full 'Design wheel'. | ||
| |||
Create map of impacts | |||
|
The purpose of an impact map is to set priorities for improvement, based on the things that matter. This is achieved by drawing a diagram that quantifies how materials and energy are used across the whole-life of the chosen benchmark product, and the corresponding costs. Drawing an impact map must start with a clearly defined purpose, which should align with the 'Product goals' identified within Manage. These goals should determine the scope of the diagram, the level of detail required, and the factors that can be considered negligible. For technology products, the impacts of customer support and consumer returns are usually significant, but often overlooked. See the Impact map section for more detail. |
choose benchmark product
Create stakeholder map
Describe user journeys
Create map of impacts
Review performance indicators
'Create map of impacts' is one of the activities within 'Explore'. Show full 'Design wheel'. | ||
Review performance indicators | |||
|
The performance indicators should cover 'whole-life' impacts for users, the business, the wider society and the planet. The different types of performance indicators are shown in the diagram below: 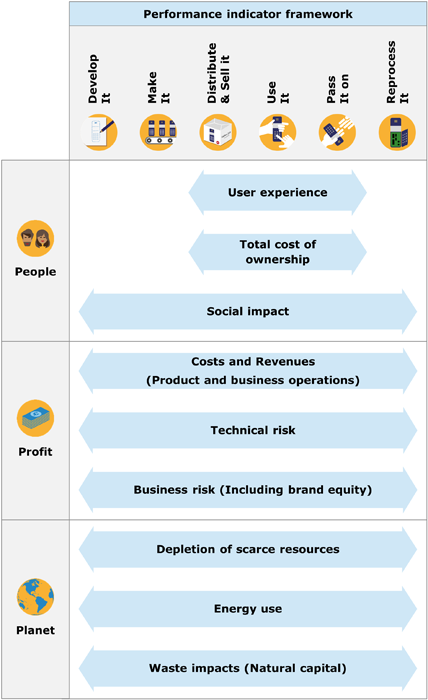
The Performance dashboard is provided as a tool that describes these performance indicators in more detail, and captures the corresponding evaluations. These performance indicators should be used as prompts to agree the 'Product goals' (within Manage). Pick one performance indicator that you want to make much better, without making any of the others any worse. |
choose benchmark product
Create stakeholder map
Describe user journeys
Create map of impacts
Review performance indicators
'Review performance indicators' is one of the activities within 'Explore'. Show full 'Design wheel'. | ||

 Next section: Create
Feedback
We would welcome your feedback on this page: